Challenge
Fragmented market participation and indicator data needed a consistent analytical model, understandable explanations, and a dependable dashboard delivery path.
Approach
Built a scheduled scoring pipeline that produces reproducible analytics and explanations, stores historical results, and delivers precomputed data to a Vue dashboard.
Outcome
Implemented participant scoring, divergence analysis, historical outputs, and offline evaluation with a clear separation between quantitative facts and supplementary context.
Engagement snapshot
Product engineering across market-data processing, deterministic scoring, explanations, historical persistence, dashboard data contracts, external context, and an optional AI interpretation foundation.
- Explainable calculations
- Explicit scoring rules and deterministic explanations
- Dashboard delivery
- Scheduled job → static JSON → Vue dashboard
- Evaluation foundation
- Historical outputs and an offline backtest runner
The scoring implementation defines normalization, participant weights, regime-dependent calculations, and divergence. Explanations are derived from finalized model outputs.
The canonical runtime stores scoring history in SQLite and exports dashboard data for GitHub Pages, without requiring a request-time scoring API.
The repository contains scoring tests and forward-return evaluation capabilities. Their existence does not establish predictive accuracy or investment performance.
Challenge
Market participation, positioning, and volatility indicators describe different aspects of the same trading environment. Bringing them into one dashboard requires consistent calculations and a clear explanation of how each input contributes to the result.
SmartMoney needed to turn those inputs into a repeatable analytical product. Historical results had to remain available for comparison and evaluation. The dashboard needed a straightforward delivery model. Supplementary news and future AI-generated commentary needed clear boundaries so they could not silently change quantitative conclusions.
The central engineering question was how to make the analysis understandable while keeping the calculations authoritative and reproducible.
Approach
Compute the analytics in one authoritative pipeline. A scheduled .NET job processes market data, applies explicit scoring rules, and produces the dashboard outputs. Short- and long-window normalization, participant weights, and regime-dependent calculations live in the scoring layer. The frontend displays the results rather than recalculating them.
Explain the result from its components. Participant contributions and indicator relationships feed deterministic explanations. Institutional-versus-retail divergence provides another view of how participant groups align or differ. This connects the displayed score with the factors that produced it.
Separate computation from delivery. The job stores scoring history in SQLite and exports static JSON. A Vue dashboard consumes those files through GitHub Pages. Viewing the dashboard does not trigger a new scoring run or depend on the secondary diagnostic API.
Keep external context independent. A separate news pipeline normalizes, deduplicates, and ranks items from configured sources. Source failures are isolated, and news does not participate in the core market score. This allows informational context to evolve independently of the quantitative model.
Solution Architecture
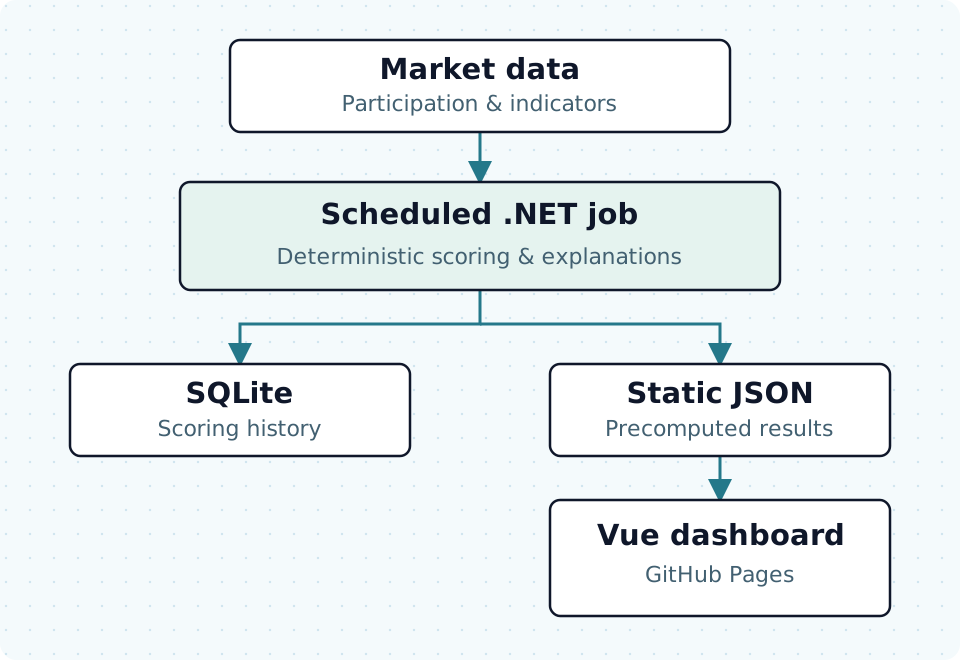
The main runtime follows a single path: source data, scheduled processing, finalized calculations, and published dashboard data. SQLite retains scoring history, while an offline runner supports historical evaluation.
An optional AI interpretation foundation sits after the quantitative outputs are finalized. Its interface, input fingerprint, timeout handling, and output validator are implemented, but no live provider is connected and the feature is disabled by default. It is an extension point for commentary; the implemented explanations remain deterministic.
Engineering Decisions
The most important boundary is between a fact calculated by the product and commentary about that fact. Scores, classifications, drivers, and evaluation results remain the responsibility of deterministic code.
The optional interpretation path accepts only a defined set of finalized inputs. It checks generated text before accepting it and can reuse a previous result only when its input fingerprint matches and validation still succeeds. If the provider is unavailable or its response fails validation, the normal quantitative output is preserved.
The same separation applies to external news. Context can help a reader explore the wider environment without changing the scoring model or blocking the core pipeline when a feed fails.
These boundaries make it possible to develop the analytical model, dashboard, and supplementary features without allowing one to quietly redefine another.
Outcome
SmartMoney has an implemented foundation for explainable market analytics:
- Reproducible scoring: explicit calculations produce participant scores, market bias, and divergence measures.
- Traceable explanations: deterministic narratives connect displayed results to their underlying contributions.
- Historical evaluation: persisted results and an offline backtest runner support investigation across past periods.
- Precomputed delivery: the Vue dashboard consumes job-generated files without a request-time scoring service.
- Independent context: news processing and the optional interpretation foundation are separated from the authoritative calculations.
These are product-engineering outcomes. The case study does not establish predictive accuracy, investment returns, measured hosting savings, or a live AI advisory capability. Upstream data reliability and automated test execution remain areas for further hardening.
The broader lesson applies to analytical products beyond markets: define which calculations are authoritative, make their outputs explainable, and give supplementary features explicit limits.
Technologies
- C# / .NET 8 for scheduled processing, scoring, and evaluation
- SQLite for scoring history
- Vue 3 for the analytical dashboard
- Static JSON for the dashboard data contract
- GitHub Pages for frontend delivery
- xUnit test artifacts for scoring and supporting behavior
From proof to your next decision
See the capability demonstrated in this engagement and the thinking behind the approach.
Microsoft & Dynamics 365 Solutions
Specialized solutions built on the Microsoft business platform.
Explore the service Related perspectiveAI Is Not a Feature. It Is a System
Teams do not struggle with AI because models are weak. They struggle because APIs, data flow, observability, and operating design are not AI-ready.
Read the insightDiscuss a similar challenge with the team behind our microsoft & dynamics 365 solutions work.
Start a conversation