Challenge
Neurosynaptic collected patient health data from remote locations via BLE medical devices, but leadership had no unified dashboard to track patient trends, regional performance, or operational metrics — delaying critical decisions.
Approach
Kindl Labs designed and implemented a Power BI-based analytics layer, transforming raw patient data into structured semantic models and building executive dashboards published via Power BI Service.
Outcome
Leadership gained centralized, near real-time visibility into patient and operational data, enabling faster decisions and establishing a scalable reporting foundation for telemedicine operations.
Engagement snapshot
Analytics modelling, executive dashboard design, and Power BI delivery over the client's existing remote-patient data infrastructure.
- Decision views
- Patient volume, regional distribution, and operational performance
- Reporting layer
- Shared semantic models and Power BI reports
- Access model
- Centralized delivery through Power BI Service
Executive dashboards consolidated the decision areas described in the engagement.
Raw patient data was transformed into reusable, analytics-ready datasets.
Reports were published for role-based leadership access; the case study does not claim a quantified adoption result.
Neurosynaptic operates a telemedicine platform that collects patient health data from remote and rural locations using compact BLE medical devices. While data collection was operational, leadership lacked a centralized, decision-ready view of patient trends, regional performance, and operational metrics.
Challenge
Patient data was dispersed across multiple remote endpoints. There was no executive dashboard, no consolidated view of operational metrics, and no mechanism to transform raw healthcare data into meaningful visual insights. Decision-making was delayed and often based on incomplete information.
Approach
Kindl Labs designed and implemented a data visualization and analytics layer on top of the existing data infrastructure:
- Data modeling and transformation — Structured and transformed raw patient data into analytics-ready semantic models supporting reporting and aggregation.
- Executive dashboard design — Built intuitive Power BI dashboards focused on leadership decision-making: patient volume trends, regional distribution, and operational performance indicators.
- Power BI implementation — Developed reports in Power BI Desktop and published them through Power BI Service for centralized, role-based access.
- Single source of truth — Ensured consistency across reports and stakeholders by establishing a centralized analytics layer over the existing patient data store.
- Performance and usability — Optimized queries and visuals for responsiveness with clean, easy-to-navigate layouts.
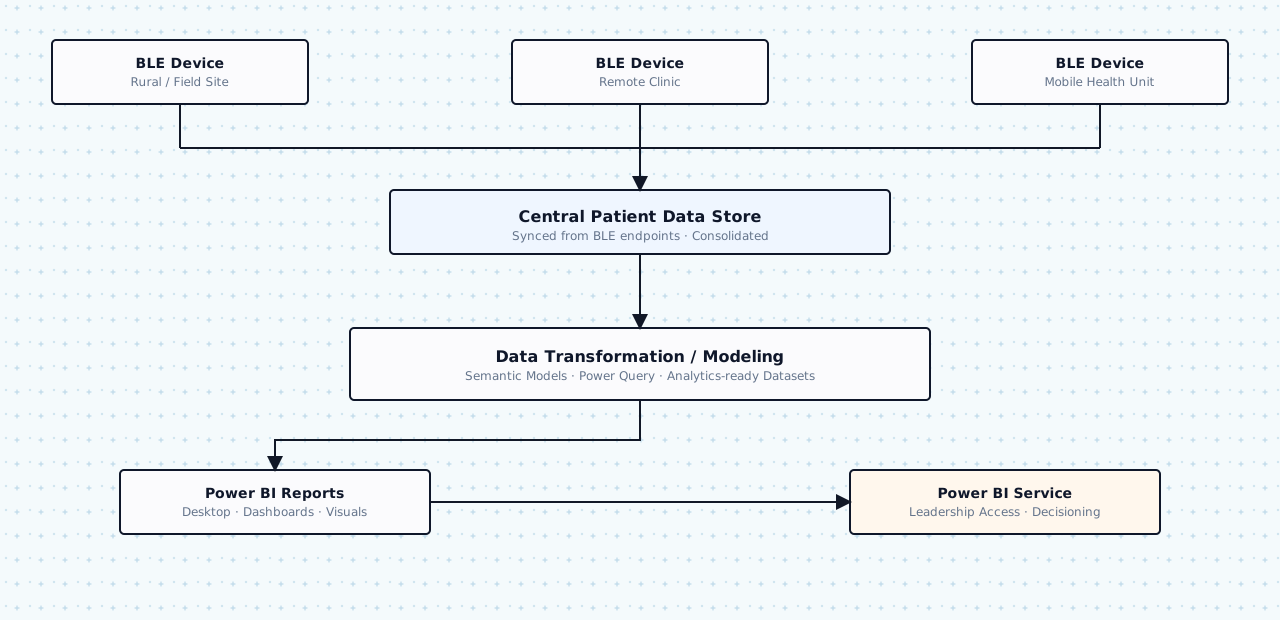
Solution Architecture
BLE Devices / Remote Data Collection
           │
           ▼
  Centralized Data Storage
  (Synced Patient Data)
           │
           ▼
  Data Transformation / Modeling
  (Analytics-ready datasets)
           │
           ▼
     Power BI Reports
  (Dashboards & Visualizations)
           │
           ▼
     Power BI Service
  (Leadership Access / Decisioning)
Outcome
- Executive visibility — Centralized dashboards gave leadership a clear view of patient and operational data across geographies.
- Faster decisions — Near real-time insights reduced delays in critical operational decisions.
- Improved data utilization — Raw collected data transformed into actionable, consumable insights.
- Scalable foundation — Power BI platform supports future expansion and additional reporting requirements.
- Regional awareness — Better understanding of patient-level and regional trends across the distributed telemedicine network.
Technologies
- Power BI
- Power BI Service
- Data modeling
From proof to your next decision
See the capability demonstrated in this engagement and the thinking behind the approach.
Data & Integrations
Connect systems, improve visibility, and make data more useful.
Explore the service Related perspectiveWhy Enterprise Integrations Break Down at Scale
Most integration failures are architectural, not technical. Point-to-point connections compound quietly into systems that are hard to diagnose, change, or operate reliably.
Read the insightDiscuss a similar challenge with the team behind our data & integrations work.
Start a conversation